Average Running Speed by Age, Sex & Distance (Charts)
The average running speed is about 6 mph (9.7 km/h), roughly a 10-minute mile. See charts by age, sex, fitness level, race distance and human top speed.
 Steps Team•
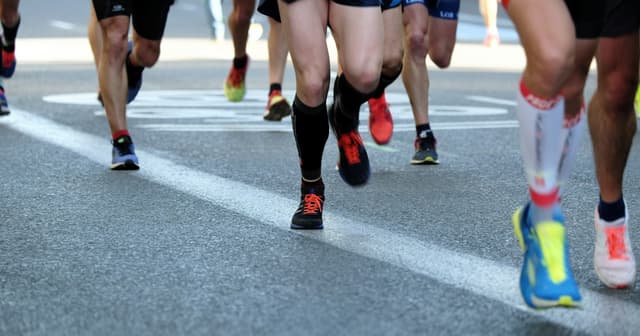
The average running speed for a recreational runner is about 6 mph (9.7 km/h), which is a pace of roughly 10 minutes per mile or 6:15 per kilometer. Most everyday runners fall somewhere between 5 and 7 mph (8 to 11.3 km/h), depending on age, sex, fitness and how far they are going.
That number comes from two very large datasets. Strava's analysis of logged runs in 2024 put the global average at 6:22 per km (10:16 per mile), or about 5.9 mph. RunRepeat's analysis of more than 35 million race results puts median finish paces between 10 and 11 minutes per mile across the 5K, 10K, half marathon and marathon.
Below you will find the average running speed broken down by age and sex, by fitness level and by race distance, plus how it compares to walking, jogging and an all-out human sprint.
Average Running Speed at a Glance
| Measure | Average Running Speed |
|---|---|
| Miles per hour | ~6 mph (range 5–7 mph) |
| Kilometers per hour | ~9.5 km/h (range 8–11.3 km/h) |
| Minutes per mile | ~10:00 (range 8:35–12:00) |
| Minutes per kilometer | ~6:15 (range 5:20–7:27) |
If you run a 10-minute mile, you are right at the average. Faster than 8:30 per mile (7 mph) puts you comfortably ahead of most recreational runners; slower than 12:00 per mile (5 mph) overlaps with what most people would call jogging.
Need to convert your own numbers? The Pace to Speed Converter turns min/mile or min/km into mph and km/h instantly.
Average Running Speed for Men and Women
Strava's 2024 data on training runs shows a clear gap between men and women:
| Group | Pace per km | Pace per mile | Speed |
|---|---|---|---|
| All runners | 6:22 | 10:16 | 5.9 mph / 9.4 km/h |
| Men | 6:14 | 10:02 | 6.0 mph / 9.6 km/h |
| Women | 7:01 | 11:18 | 5.3 mph / 8.6 km/h |
These are everyday training runs, not races, so they include easy recovery jogs as well as harder efforts. In the US specifically, Strava has reported slightly faster figures in past years, with men averaging about 9:03 per mile and women about 10:21 per mile in its 2015 data set.
The gap between men and women narrows considerably as distance grows. In RunRepeat's marathon data, women's median pace is about 11% slower than men's, while at shorter distances the gap is larger.
Average Running Speed by Age
Age is one of the biggest questions people have about running speed. The best large-scale source is race data: the table below converts average 5K finish times by age and sex (IAAF and RunRepeat data, 2018) into pace and speed.
Men
| Age | Avg 5K Time | Pace per Mile | Pace per km | Speed |
|---|---|---|---|---|
| Under 20 | 31:28 | 10:08 | 6:18 | 5.9 mph / 9.5 km/h |
| 20–29 | 33:19 | 10:43 | 6:40 | 5.6 mph / 9.0 km/h |
| 30–39 | 34:36 | 11:08 | 6:55 | 5.4 mph / 8.7 km/h |
| 40–49 | 35:24 | 11:24 | 7:05 | 5.3 mph / 8.5 km/h |
| 50–59 | 36:34 | 11:46 | 7:19 | 5.1 mph / 8.2 km/h |
| 60+ | 40:42 | 13:06 | 8:08 | 4.6 mph / 7.4 km/h |
Women
| Age | Avg 5K Time | Pace per Mile | Pace per km | Speed |
|---|---|---|---|---|
| Under 20 | 38:38 | 12:26 | 7:44 | 4.8 mph / 7.8 km/h |
| 20–29 | 38:44 | 12:28 | 7:45 | 4.8 mph / 7.7 km/h |
| 30–39 | 40:13 | 12:57 | 8:03 | 4.6 mph / 7.5 km/h |
| 40–49 | 41:40 | 13:25 | 8:20 | 4.5 mph / 7.2 km/h |
| 50–59 | 43:57 | 14:09 | 8:47 | 4.2 mph / 6.8 km/h |
| 60+ | 48:41 | 15:40 | 9:44 | 3.8 mph / 6.2 km/h |
Two things stand out. First, the decline with age is gradual: a man in his 50s is only about half a mph slower on average than a man in his 20s. Second, these race averages are slower than the Strava training numbers because 5K fields include many walkers, walk-run participants and first-timers. If you run the whole way, you are likely already faster than the average running speed for your age group in these tables.
Fitness history matters more than age. A trained 55-year-old routinely outruns an untrained 25-year-old, so treat these as reference points rather than targets.
Average Running Speed by Fitness Level
Because "average" blends beginners with seasoned runners, it helps to see typical ranges by experience. These are general training benchmarks for an easy-to-steady run, not race efforts:
| Level | Typical Speed | Pace per Mile | Pace per km |
|---|---|---|---|
| Beginner (0–6 months) | 5.0–5.5 mph | 10:55–12:00 | 6:47–7:27 |
| Recreational | 5.5–6.5 mph | 9:14–10:55 | 5:44–6:47 |
| Intermediate | 6.5–7.5 mph | 8:00–9:14 | 4:58–5:44 |
| Advanced / club runner | 7.5–9.0 mph | 6:40–8:00 | 4:08–4:58 |
| Elite marathoner (race pace) | 12.5–13 mph | 4:36–4:48 | 2:51–2:59 |
The jump from beginner to intermediate usually comes from consistent weekly mileage rather than speed workouts. Simply running three or four times a week, month after month, is what moves most people up this table.
Want to see where your pace sits across different effort levels? The Training Pace Zones tool builds easy, tempo and interval paces from a recent race result.
Average Running Speed by Race Distance
Race distance has a big effect on pace. Here are the median (50th percentile) finish times from RunRepeat's database of more than 35 million race results, converted to speed:
| Distance | Median Finish | Pace per Mile | Pace per km | Speed |
|---|---|---|---|---|
| 5K | 34:37 | 11:09 | 6:55 | 5.4 mph / 8.7 km/h |
| 10K | 1:02:08 | 9:59 | 6:13 | 6.0 mph / 9.7 km/h |
| Half marathon | 2:14:59 | 10:18 | 6:24 | 5.8 mph / 9.4 km/h |
| Marathon | 4:26:33 | 10:10 | 6:19 | 5.9 mph / 9.5 km/h |
Logic says shorter races should be faster, and for any one runner they are. The averages look flat (or even reversed at the 5K) because of who shows up. Half marathon and marathon fields are almost entirely trained runners, while 5K fields are open to everyone, including walkers and families.
For your own predictions across distances, plug a recent time into the Race Time Predictor, or use the Marathon Pace Predictor if you are targeting 26.2. Curious how much ground that covers on foot? See how many steps are in a marathon and how many miles is a 5K.
Average Human Running Speed vs Top Speed
The average human running speed for a sustained run (about 6 mph) is a world away from a flat-out sprint:
| Runner | Speed | Equivalent Pace per Mile |
|---|---|---|
| Average recreational runner | ~6 mph / 9.7 km/h | ~10:00 |
| Untrained adult, short sprint | ~12–15 mph / 19–24 km/h | ~4:00–5:00 (not sustainable) |
| Kelvin Kiptum, marathon world record (2:00:35) | 13.0 mph / 21.0 km/h | 4:36 |
| Usain Bolt, 100 m world record (9.58 s), average | 23.4 mph / 37.6 km/h | 2:34 |
| Usain Bolt, peak speed during that race | ~27.8 mph / ~44.7 km/h | n/a |
The striking line is the marathon record. The late Kelvin Kiptum held 13 mph for over two hours, which is about as fast as most untrained adults can sprint for a few seconds. Bolt's average across the full 100 meters, including the start, was nearly four times the average running speed of a recreational runner.
Running vs Jogging vs Walking Speed
Running, jogging and walking overlap more than people think. Speed is a rough guide, but the real difference is gait: running and jogging have a flight phase where both feet leave the ground.
| Activity | Typical Speed | Pace per Mile |
|---|---|---|
| Casual walk | 2.5–3.0 mph | 20:00–24:00 |
| Brisk walk | 3.5–4.0 mph | 15:00–17:10 |
| Jogging | 4.0–6.0 mph | 10:00–15:00 |
| Running (average) | 6.0–7.0 mph | 8:35–10:00 |
| Fast running | 8.0+ mph | under 7:30 |
| Sprinting | 12.0+ mph | under 5:00 |
Put simply, the average running speed is about twice the average walking pace of roughly 3 mph. That is why a 30-minute run covers about the same ground as an hour of walking. If you walk long distances, such as walking 6 miles a day, a steady run at the average pace would cover the same distance in about an hour.
For the slower end of this table, including jogging speed by age and how to find a sustainable jog, see our dedicated guide to average jogging speed.
What Affects Your Running Speed?
Fitness and training volume. Aerobic fitness, often measured as VO2 max, is the strongest predictor of how fast you can run for a sustained period. You can estimate yours with the VO2 Max Calculator.
Effort level. Most of your runs should be easy. A conversational pace is often 1 to 2 minutes per mile slower than race pace, which is one reason Strava's training averages look slower than people's personal bests.
Age and sex. As the tables show, both shift the average running speed, but less dramatically than many expect.
Terrain and weather. Hills, trails, heat and humidity all slow you down. A pace that feels easy on a cool, flat road can feel hard on a hot, hilly route.
Cadence and stride. Faster runners take slightly more steps per minute and cover more ground per step. See how many steps in a mile running for stride and cadence detail.
Heart rate. Running at the right intensity matters as much as speed. If you use heart rate zones to pace yourself, the Heart Rate Zones Calculator and our guide to walking heart rate show how effort changes as you move from walking to running.
How to Improve Your Running Speed
- Run more, mostly easy. Building weekly mileage by about 10% at a time is the most reliable way to raise your average running speed.
- Add one faster session a week. Short intervals (for example, 6 x 400 m) or a 20-minute tempo run teach your body to hold a quicker pace.
- Try strides. Four to six 20-second accelerations at the end of an easy run improve form and leg speed with little fatigue.
- Use walk breaks if you are new. The walk-run method helps beginners build endurance first, which leads to faster running later.
- Track your pace over time. A single fast run means little. A steady improvement in pace at the same effort over several weeks is real progress.
The Running Pace Calculator is handy for setting targets: enter a goal time and distance to see the pace per mile or km you need to hold.
Frequently Asked Questions
What is the average running speed in mph?
The average running speed is about 6 mph for recreational runners, which equals a 10-minute mile. Most everyday runners fall between 5 and 7 mph, with men averaging slightly faster than women.
What is the average running speed in km/h?
The average running speed is roughly 9.5 to 9.7 km/h, or a pace of about 6:15 to 6:22 per kilometer. Strava's 2024 data put the global average at 6:22 per km.
What is the average human running speed?
For sustained running, the average human running speed is about 6 mph (9.7 km/h). For a short all-out sprint, an untrained adult typically reaches somewhere around 12 to 15 mph, while elite sprinters exceed 25 mph at peak.
Is a 10-minute mile a good running pace?
Yes. A 10-minute mile (6 mph) is right at the average running speed for recreational runners. Running it comfortably for several miles puts you ahead of many people who enter 5K races.
What is the average running speed by age?
Based on 5K race data, men average about 5.6 mph in their 20s and 5.1 mph in their 50s, while women average about 4.8 mph in their 20s and 4.2 mph in their 50s. These race averages include walkers, so regular runners are usually faster.
How fast should a beginner run?
Most beginners run at 5 to 5.5 mph (11 to 12 minutes per mile). Starting at a pace that lets you talk in full sentences keeps injury risk low and helps you build the endurance needed to get faster.
What is the difference between running speed and jogging speed?
Jogging is generally 4 to 6 mph, while running is usually 6 mph and above. The line is blurry; effort matters more than the exact number. Our average jogging speed guide covers the slower range in detail.
Track Your Running Speed with Steps
Knowing the average running speed is useful, but your own trend line is what matters. Steps is a free iPhone pedometer and workout tracker that records your steps, distance, pace and calories for every walk and run, so you can see your speed improve week by week.
Ready to see how your pace compares? Download Steps and start tracking your runs today.
Related reading: average jogging speed, average walking pace, running pace calculator guide and walking vs running for weight loss.
You Might Also Like
Try Our Calculators
Steps is built by runners who wanted a step counter that felt right. Read our story