Body Fat Percentage Chart by Age for Men and Women
Body fat percentage chart for men and women: ACE categories, healthy ranges by age, US averages, and how accurate DEXA, calipers, and smart scales are.
 Steps Team•
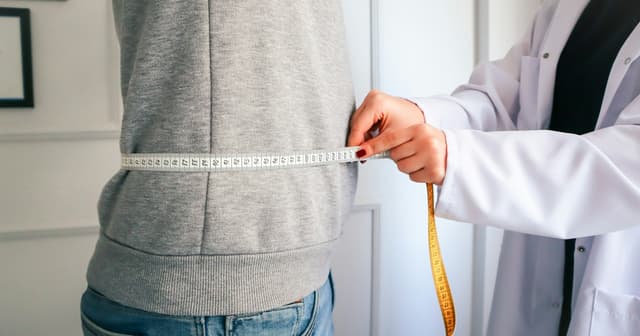
A body fat percentage chart compares the share of your weight that is fat with reference ranges for your sex and age. On the American Council on Exercise (ACE) chart, the "fitness" and "acceptable" categories span 14 to 24% for men and 21 to 31% for women. Age-based research ranges are wider: 8 to 20% for men and 21 to 33% for women at ages 20 to 39, rising to 13 to 25% and 24 to 36% at ages 60 to 79. The average American adult is above both, at about 28% for men and 40% for women.
Those three sets of numbers come from three different sources, which is why charts online rarely agree. One is a set of fitness categories, one links body fat to healthy BMI ranges by age, and one is simply what the US population measures. This page gives each chart separately with its source named, then covers how to read them together and how far to trust your own measurement.
If you don't know your number yet, the body fat calculator estimates it from a tape measure in under a minute. This article is general information, not medical advice. Body fat is one health marker among several, so talk with a doctor before acting on a single reading.
Body Fat Percentage Chart for Men and Women (ACE)
The most widely reproduced chart comes from the American Council on Exercise. It sorts adults into five categories and does not adjust for age.
| Category | Men | Women |
|---|---|---|
| Essential fat | 2–5% | 10–13% |
| Athletes | 6–13% | 14–20% |
| Fitness | 14–17% | 21–24% |
| Acceptable (also labeled "average") | 18–24% | 25–31% |
| Obese (ACE's label) | 25% and above | 32% and above |
Source: American Council on Exercise body fat categories.
How to read it:
- Essential fat is the minimum the body needs for normal function. It is a floor, not a goal. ACE notes that levels below about 6% for men and 14% for women can carry health risks.
- Athletes and fitness describe what is typical for people who train regularly. They are descriptions, not requirements for good health.
- Acceptable is the range ACE describes as typical for the average nonathlete.
- The top category is a label based on body fat alone. It says nothing about fitness, blood work, or habits, and because the chart ignores age it is strict for older adults.
Body Fat Percentage Chart by Age (Gallagher et al.)
Most age-adjusted charts trace back to one study: Gallagher and colleagues, published in the American Journal of Clinical Nutrition in 2000. The researchers measured body fat in 1,626 adults in the US, UK, and Japan, then worked out which body fat percentage corresponds to the standard BMI cutoffs of 18.5, 25, and 30 at different ages.
Men
| Age | Below the range | Matches a healthy BMI | Matches an overweight BMI | Matches a BMI of 30 or more |
|---|---|---|---|---|
| 20–39 | Under 8% | 8–20% | 20–25% | 25% and above |
| 40–59 | Under 11% | 11–22% | 22–28% | 28% and above |
| 60–79 | Under 13% | 13–25% | 25–30% | 30% and above |
Women
| Age | Below the range | Matches a healthy BMI | Matches an overweight BMI | Matches a BMI of 30 or more |
|---|---|---|---|---|
| 20–39 | Under 21% | 21–33% | 33–39% | 39% and above |
| 40–59 | Under 23% | 23–34% | 34–40% | 40% and above |
| 60–79 | Under 24% | 24–36% | 36–42% | 42% and above |
Source: Gallagher et al. 2000, Table 4 (African American and white adults, estimates centered on ages 30, 50, and 70).
A few things to know before you use this chart:
- The ranges are tied to BMI, not to health outcomes. The authors call them provisional and say the data needed to link body fat directly with illness and mortality were not available.
- Some versions print 8–19% where this one says 8–20%. It is the same data, with the bands rounded so they don't overlap.
- Ranges differ by ethnicity. The study reported separate values for Asian adults, who carried more body fat at the same BMI: about 13–23% for men and 25–35% for women at ages 20 to 39.
Average Body Fat Percentage by Age (NHANES)
The third chart is not a target. It shows what US adults measured when the CDC scanned a national sample with DEXA during the 1999–2004 National Health and Nutrition Examination Survey.
| Age | Men (average) | Women (average) |
|---|---|---|
| 16–19 | 22.9% | 34.8% |
| 20–39 | 26.1% | 37.8% |
| 40–59 | 28.6% | 40.5% |
| 60–79 | 30.8% | 42.4% |
| 80 and older | 30.7% | 40.4% |
| All adults 20 and older | 28.1% | 39.8% |
Source: CDC National Center for Health Statistics, Vital and Health Statistics Series 11, No. 250, Table 3 (NHANES 1999–2004, DEXA).
The middle half of adults fell between about 24% and 32% for men and between 35% and 45% for women. In other words, the typical American adult measures above the "acceptable" band on the ACE chart.
Part of that gap is real and part is method. Different methods give different numbers for the same person, and the CDC adjusted its scanner data upward after finding the software underestimated fat. A later analysis of the same NHANES data found that a BMI of 25 corresponded to roughly 23 to 28% body fat in men and 35 to 40% in women, depending on age and ethnicity. That is several points higher than Gallagher's cutoffs. The lesson: compare your number with a chart built on a similar method, and treat every cutoff as approximate.
Average vs Healthy vs Athletic: Reading the Charts Together
Here is how the three sources line up for adults aged 20 to 39:
| What it describes | Men | Women | Source |
|---|---|---|---|
| Athletes | 6–13% | 14–20% | ACE |
| Fitness | 14–17% | 21–24% | ACE |
| Matches a healthy BMI | 8–20% | 21–33% | Gallagher et al. |
| US average | 26.1% | 37.8% | NHANES |
Athletic ranges describe people who train hard, often for a sport that rewards leanness. Healthy ranges are wide, and the lower end is not better than the middle. Average tells you what is common, which is not the same as what is recommended.
What Is the Ideal Body Fat Percentage?
There is no single ideal body fat percentage. None of these sources names one, and the Gallagher authors say outright that their ranges are a starting point. A reasonable way to use the charts is to find the healthy-BMI range for your sex and age and aim to sit somewhere inside it, without chasing the bottom. If you already have a number, the more useful question is whether it is stable or drifting over the years.
Body fat is also only one marker. Cardio fitness matters independently, which is why it is worth knowing your VO2 max by age and your resting heart rate too. Where fat sits matters as well, so pair your result with the waist-to-hip ratio calculator and the BMI calculator.
Why Women's Ranges Are Higher
Every body fat percentage chart lists women higher than men, and that is physiology, not a fitness gap.
- Essential fat is higher. ACE puts it at 10–13% for women and 2–5% for men. Part of women's essential fat is sex-specific fat in the breasts, hips, and thighs, linked to reproductive hormones.
- The gap shows up in every dataset. In the Gallagher chart, women's ranges sit 11 to 13 points above men's. In the CDC data, women averaged more body fat than men at every age, with a gap of about 12 points through most of adulthood.
A woman at 26% and a man at 14% are in the same place on the chart. Comparing raw numbers across sexes is misleading.
Why the Ranges Rise With Age
In the Gallagher study, older adults had more body fat than younger adults at the same BMI. Muscle mass tends to decline with age, so fat makes up a larger share of the same body weight even when the scale has not moved. That is why the upper end of the healthy-BMI range climbs from 20% to 25% for men and from 33% to 36% for women between the youngest and oldest groups.
The authors flag an open question here: whether carrying more fat at older ages is harmless or simply common. Either way, the practical response is the same. Staying active and keeping muscle slows the drift. Walking helps with the first part, and walking does build some muscle, though strength training does more.
How Accurate Is Your Number?
Every method estimates body fat. None measures it directly, and each carries its own error.
| Method | What it uses | How far to trust it |
|---|---|---|
| DEXA scan | Low-dose X-ray | The most detailed option widely available and the method behind the CDC averages. Results still vary by machine and software. |
| Skinfold calipers | Pinch thickness at several sites | Depends heavily on the tester's skill and the equation used. Best with the same tester each time. |
| Navy tape method | Neck, waist, height (plus hips for women) | The Navy's original validation of the men's equation reported a standard error of about 3.5 percentage points against underwater weighing. |
| BIA smart scales | A small electrical current | Varies widely by device and by hydration. In one study of 106 adults, agreement with reference methods ranged from about 6.6 points below to 4.6 points above for the best device, and from 14.5 below to 8.6 above for the least accurate foot-to-foot scale. |
An error of 3 to 4 points matters when you read a chart. A tape result of 22% could really be anywhere from about 18% to 26%, which spans two ACE categories. So treat your category as approximate, use one method, and measure under the same conditions each time. The trend is more reliable than any single reading.
For the measuring technique and the Navy formulas, see how to calculate body fat percentage, or skip the math with the body fat calculator.
What Is a Realistic Rate of Change?
For most people, a drop of roughly 1 percentage point a month is realistic, a pace widely attributed to ACE as a safe target. The arithmetic backs it up.
The CDC recommends losing about 1 to 2 pounds a week. Take someone who weighs 80 kg (176 lb) at 30% body fat, which is 24 kg of fat. Losing 2 kg in a month, about 1 pound a week, gives:
| If the 2 kg lost is | New body fat | Change |
|---|---|---|
| All fat | 28.2% | Down 1.8 points |
| Three quarters fat | 28.8% | Down 1.2 points |
At half that pace, the change is about 0.6 to 0.9 points a month. Because measurement error is larger than a month of progress, re-measure every 4 to 6 weeks and judge the trend over 3 months.
What moves the number:
- A moderate calorie deficit. Start with what a calorie deficit is, then set yours with the calorie deficit calculator.
- Daily walking. It raises the calories you burn and is easy to repeat. See does walking burn fat and does walking reduce belly fat.
- Strength training and enough protein, so more of what you lose is fat.
If you would rather work toward a weight target, the ideal weight calculator gives a range for your height.
Frequently Asked Questions
What is a healthy body fat percentage?
Using the Gallagher et al. ranges that match a healthy BMI, it is 8 to 20% for men and 21 to 33% for women at ages 20 to 39, 11 to 22% and 23 to 34% at ages 40 to 59, and 13 to 25% and 24 to 36% at ages 60 to 79.
What is the average body fat percentage?
In CDC survey data measured by DEXA, US adults aged 20 and older averaged 28.1% for men and 39.8% for women. Averages rise with age, from 26.1% and 37.8% at ages 20 to 39 to 30.8% and 42.4% at ages 60 to 79.
Is 25% body fat good?
It depends on sex and age. For a woman, 25% is in ACE's "acceptable" category and inside the healthy-BMI range at every age. For a man, 25% is the top of that range at ages 60 to 79, above it at younger ages, and still below the US male average of 28.1%.
Which body fat percentage chart should I use?
Use the ACE chart for a quick category and the age-based chart for a range that fits your stage of life. If your number comes from a DEXA scan, compare it with DEXA-based figures such as the CDC averages, since a tape or caliper estimate may not line up with it.
Is body fat percentage better than BMI?
They answer different questions. BMI is a quick screen based on height and weight. Body fat percentage separates fat from lean mass but is harder to measure well. Used together with waist measurements, they give a fuller picture than either alone.
How often should I measure body fat?
Every 4 to 6 weeks, with the same method, at the same time of day. Body fat changes slowly, and more frequent readings mostly capture measurement noise.
Use the Chart, Then Track the Trend
A body fat percentage chart gives you context, not a verdict. Find the range for your sex and age, remember that your reading could be off by a few points, and watch the direction over months.
Steps: Workout & Pedometer counts every step automatically on your iPhone and Apple Watch, so you can see whether you are moving more this month than last.
Ready to build the walking habit behind a healthier body composition? Download Steps
You Might Also Like
Try Our Calculators
Steps is built by runners who wanted a step counter that felt right. Read our story